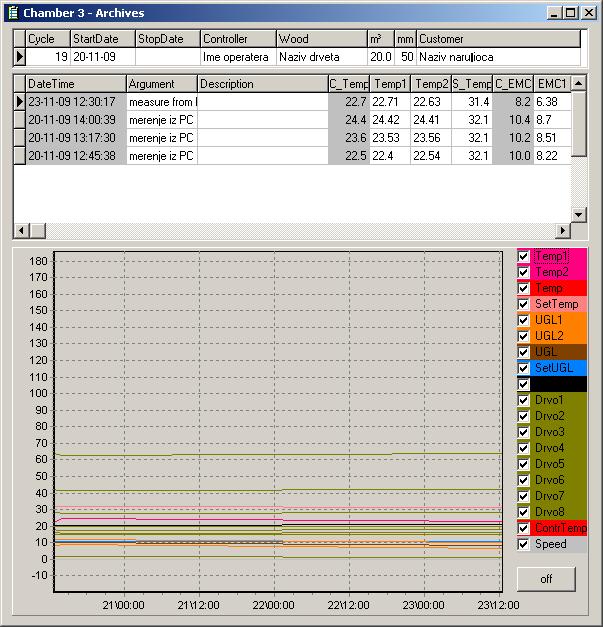
Displays the time flow diagram of the drying process.
The first table shows description of the drying cycle (turnus). It shows sequence number of drying cycle, drying start date, stop date (shown only when drying process is stopped), operator name, timber description, timber volume, timber thickness and customer description or other text information. These data are filled by pressing the right mouse button on the box Cycle.
The second table shows data recorded by the PC and the automation (only if this is the type of controller that is capable of archiving). Automatic controller archive data every 3 hours. PC archiving time is defined in the software. In addition to scheduled archiving, the PC records the information in the moments when something happened that is important for the drying process. Right click mouse button on the table with the data to open pop-up menu for further manipulationwith the data from the archive.
The graphic shows visual display of the progress of individual measured values. The legend on the right side describes which value corresponds to each curve. Each curve can be switched on or off from display. Button Turn off / on can turn on or off all curves. Right click mouse button on curves diagram to open pop-up printing menu and print the curves.